Sleep tracker
Log your hours of sleep each night. A highlight range from 7 to 9 shows which nights reached the target.
How it’s set up
- Labels from
- Night
- Values from
- Hours
- Show highlight range
- On
- From value
- 7
- To value
- 9
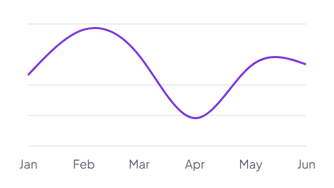
A smooth curve with no fill, so the line itself carries the trend and several lines stay easy to tell apart. Hover over the chart to see the values for each label.
Each example puts the widget on a Notion page and lists the settings it uses.
Log your hours of sleep each night. A highlight range from 7 to 9 shows which nights reached the target.
Pick two number properties, one for each year. Turn on the legend so readers know which line is which.
Log each practice session with a Week and a Minutes property. Set Shorten to 0 for full week names, and turn on points to mark each total.
The same line chart widget with a different look. Each variant has its own page.
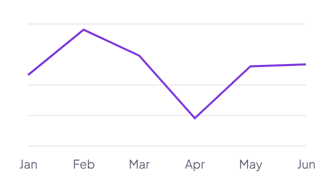
Short data sets where each rise and drop matters
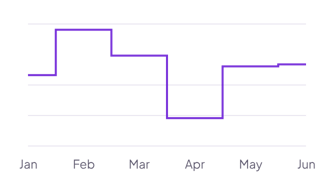
Values that change in jumps, such as rates, levels or stock
Start from the Normal variant and change any part of it. Try it in your browser first, no account needed.